Performance
Every number on this page is measured, not projected, and — apart from the one line that says otherwise — every one comes from the same machine:
12-core AMD EPYC Genoa (KVM guest), 22 GB RAM, Ubuntu 24.04.4, kernel 6.8.0-90, Go 1.26.5. AVX2, AVX-512 and AVX-512-VNNI available.
That includes the six-engine VectorDBBench comparison summarised below, which has always run on this hardware. Stating one configuration is the point: figures gathered on different machines cannot be compared to each other, and a page that mixes them silently invites exactly that mistake.
Same machine, not the same sitting. The engine-to-engine comparison was captured in its own continuous session, which is what makes those ratios meaningful; everything else here was measured later on the same box. Where a cross-session claim would be load-bearing it is called out — see the re-verification note under the head-to-head.
What this configuration does not tell you is how Rostam behaves on yours. Core
count matters a great deal here — the key-value figures are parallel benchmarks
whose per-op cost depends directly on GOMAXPROCS, so they are quoted with the
thread count attached. Re-run make bench on your own hardware before sizing
anything.
Competitive, reproducible head-to-head comparisons against other engines live
in the separate rostam-bench
repository, so this module's go.mod stays dependency-light.
Vector search (this module's numbers)
| Aspect | Result |
|---|---|
| SQ8 quantization (4× smaller) | recall@10 ≈ 0.98 of exact float32 |
| Binary quantization (32× smaller) | recall@10 ≈ 0.96 of exact (clustered corpus, rescored) |
| Selective metadata filter | filter-first path is exact — no graph-recall cliff |
The recall figures are properties of the algorithm and do not vary with hardware. The distance kernels do, so they are given as measured:
| Kernel (median ns/op) | scalar | AVX2 | AVX-512 | speedup |
|---|---|---|---|---|
| float32 dot, 768d | 451.6 | 35.8 | 34.8 | 12.6× |
| float32 dot, 1536d | 933.1 | 64.4 | 67.3 | 14.5× |
| float32 L2², 768d | 498.5 | 35.3 | 35.4 | 14.1× |
| int8 (SQ8) dot, 768d | 229.7 | 69.2 | — | 3.3× |
| int8 (SQ8) dot, 1536d | 452.6 | 154.4 | — | 2.9× |
| int8 dot, 128d, VNNI vs AVX2 | — | 7.76 | 5.87 (VNNI) | 1.3× |
Two things worth reading off that table rather than skipping:
- AVX-512 is not a win over AVX2 for float32 here, and sometimes loses. Zen 4 implements AVX-512 on 256-bit hardware, so the wider instructions buy little. The AVX-512 assembly is correct — its differential tests against the scalar reference pass — it simply is not faster on this CPU. On an Intel server part with native 512-bit datapaths the picture would differ.
- VNNI is the one that pays, and only for int8: 5.87 ns against AVX2's 7.76 ns. That is the kernel quantized search actually leans on.
The filter-first claim is runnable:
examples/filtered-recall-cliff
compares post-filtering, filter-aware traversal, and filter-first as filter
selectivity tightens.
Growing a collection doesn't stall queries
A vector collection stores its vectors, its graph edges, and its quantization codes in flat arrays indexed by slot. Those arrays have to grow as the collection does, and a flat array historically grew by allocating a bigger one and copying — with queries locked out for the duration. At 500k × 768d that copy was over a second.
Those three arrays now grow in place: each reserves a large range of virtual address space up front and makes more of it usable as needed, so nothing is copied and nothing moves. Worst-case query latency at a growth boundary, 500k × 768d:
| Storage | Worst query, before | Worst query, after | after: p50 / p99.9 |
|---|---|---|---|
Heap (QuantInRAM) |
1.985 s | 3.58 ms | 886 µs / 1.465 ms |
Memory-mapped (QuantMmap) |
741 ms | 4.04 ms | 420 µs / 1.003 ms |
The p50 column is there because the maximum alone would let you assume the
typical query got slower to buy that worst case down. It didn't — median latency
is unchanged, and the tail is what collapsed. Reproduce with
ROSTAM_GROW_LATENCY=1 go test ./vector/ -run TestGrowStallLatency -v (needs
several GB of RAM).
Two things worth knowing when you operate this:
- Virtual size grows, resident size does not. A large collection reserves far
more address space than it uses, so
VIRT/VSZintoporpscan read tens of gigabytes while actual memory use is unchanged. Reserved-but-unused address space costs no memory, no swap, and nothing against overcommit. MeasureRSS, notVIRT— an alert on virtual size will fire spuriously. - Setting
MaxVectorssizes the reservation. With a declared cap the reservation is sized from it; without one, a generic growth factor is used. Either way the cap is a hint for sizing, never a limit on growth.
This is automatic and has no configuration knob. It engages only once an array passes ~32 MiB, so small collections are unaffected. It requires 64-bit Linux; on other platforms collections fall back to copy-on-grow and behave exactly as before.
Key-value (this module's numbers)
In-process, Direct backend. These are b.RunParallel benchmarks at
GOMAXPROCS=12, so per-op cost scales with core count — on a wider machine
the same code reports a lower ns/op, and on a narrower one, higher. The thread
count is part of the number.
| Op | Result | Notes |
|---|---|---|
| Get (hit) | ~29 ns/op, 1 alloc | RLock + index lookup into a sharded slab store. The allocation is the returned value — see the note below, it depends on the eviction policy |
| Put | ~240 ns/op | |
| Incr (atomic RMW) | via the op registry | store.Call("incr", …), serialized per shard |
Backends trade latency for durability/replication:
| Backend | Get | Put | When |
|---|---|---|---|
Direct (no Raft) |
~29 ns | ~240 ns | single node, library |
Embedded (Raft, no-sync) |
~222 ns | ~12.7 µs | replicated / multi-node |
The ~8× Get gap and the ~50× Put gap between the two backends are the cost of
consensus, not of storage: the Direct path is the same code with the log
removed.
Whether Get allocates depends on the eviction policy, and the difference is
a semantic one, not just a number:
PolicyRingbufEvict(the default, and what the figures above use) returns a freshly allocated copy you own and may retain and mutate freely — one allocation per hit. Eviction can overwrite live page bytes, so handing out a pointer into the store would be unsafe.PolicyRejectWritesnever overwrites live bytes, soGetreturns a slice aliasing the page store — zero allocations, but you must not retain it across later writes to that shard.GetIntoallocates nothing on either policy: it copies into a buffer you supply. Allocation-free, not copy-free.
Earlier revisions of this page and the README quoted the zero-allocation figure
without naming the policy, which read as a property of Get when it is a
property of one configuration.
Networked figures (TCP over loopback, ~1.7 µs Get / ~1.8 µs Put against a
Direct server) are not from this machine — its NIC exposes a single
combined queue (ethtool -l → Combined: 1), which caps any fast engine well
below its real ceiling and would measure the network adapter rather than the
storage path. They are quoted from a multi-queue host and should be treated as
the one figure on this page that is not like-for-like with the rest.
Search on a real corpus (SIFT-1M)
The kernel numbers above are microbenchmarks. This is the whole index doing the
whole job: SIFT-1M (1M × 128d, L2), the standard ANN corpus, with its published
ground truth. ef_search swept, k=10, single-threaded serial latency alongside
saturated throughput:
| ef_search | recall@10 | p50 | p99 | saturated QPS |
|---|---|---|---|---|
| 16 | 0.823 | 59 µs | 98 µs | 178,834 |
| 64 | 0.968 | 173 µs | 232 µs | 60,413 |
| 128 | 0.991 | 323 µs | 432 µs | 30,883 |
Recall and latency move together, which is the whole point of the knob: 0.97 recall costs ~173 µs at the median, and buying the last 2.3 points of recall roughly doubles it. Pick the row, not the engine.
Reproduce with the dataset in /tmp/rostam-sift1m/sift/:
Reproducing
make bench currently interleaves hashicorp/raft's DEBUG output with the
benchmark results on the Embedded cases, which makes them awkward to read.
Filter with grep -E '^Benchmark.*ns/op'.
Vector head-to-head (VectorDBBench)
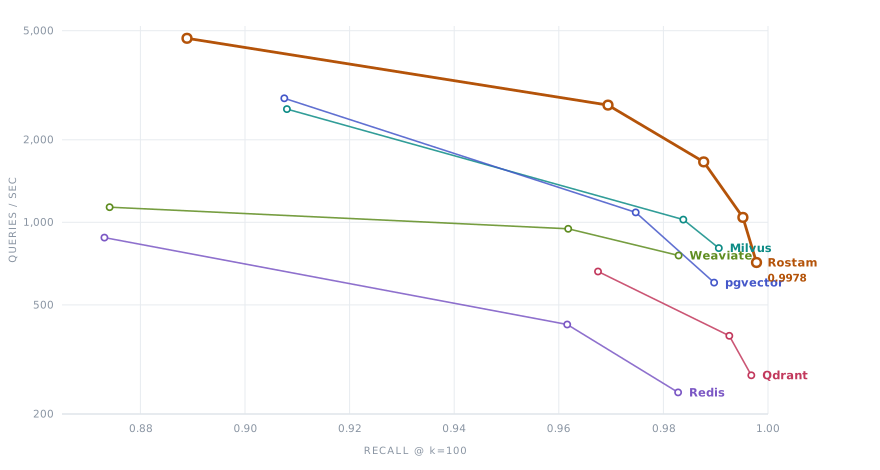
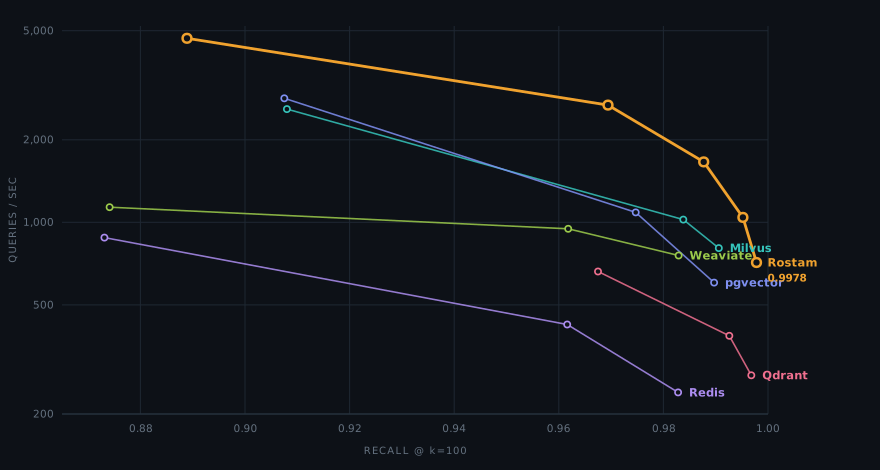
Six engines, one machine, one continuous session: VectorDBBench 1.0.22 running Cohere-1M (768d, cosine) across 27 cases on a 12-core AMD EPYC Genoa with 22 GB RAM, one engine at a time over loopback. HNSW parameters are pinned identically on every engine — m=16, ef_construction=200, k=100 — and ef_search is swept. Versions: Rostam v0.1.0, Qdrant v1.18.3, Milvus v3.0.0, PostgreSQL 17.10 + pgvector 0.8.6, Weaviate 1.31.0, Redis 7.4.7 (redis-stack).
Re-verified. Rostam's arm of this comparison was re-run independently on the same hardware at a later commit, sweeping ef_search over 64/128/256/512 to recall 0.889/0.915/0.962/0.985. Interpolated to the matched-recall levels below it landed within ±3% of the figures in the table — 0.95 within +2.5%, 0.97 within −2.8%, in opposite directions. Two sessions months apart agreeing to that margin is the strongest statement available about whether these numbers are stable; the competitor arms were not re-run, so the ratios rest on the original same-session measurement, which is the only way they are meaningful anyway.
QPS at matched recall
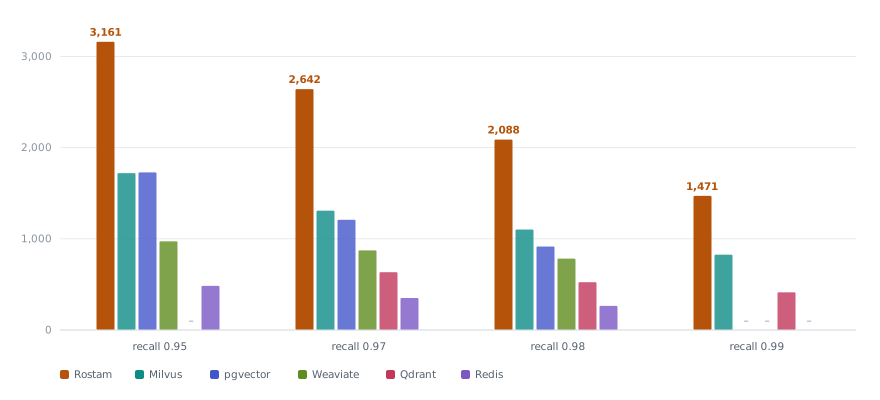
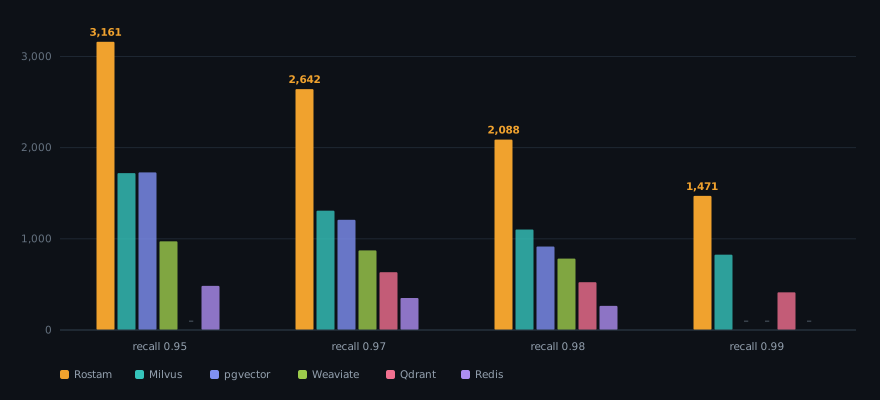
Each engine's throughput/recall curve is interpolated to a common recall level. Comparing at matched recall rather than matched ef is essential: Qdrant runs 5 segments (measured) and searches each with the full ef, so at a nominal ef=100 it performs ~5 graph searches where a single-index engine performs one. Equal ef is not equal work. A blank cell means that recall level is outside the engine's measured range.
| Matched recall | Rostam | vs Milvus | vs pgvector | vs Weaviate | vs Qdrant | vs Redis |
|---|---|---|---|---|---|---|
| 0.95 | 3,161 QPS | 1.84x | 1.83x | 3.25x | — | 6.54x |
| 0.97 | 2,642 QPS | 2.02x | 2.18x | 3.03x | 4.16x | 7.53x |
| 0.98 | 2,088 QPS | 1.90x | 2.28x | 2.67x | 3.98x | 7.90x |
| 0.99 | 1,471 QPS | 1.78x | — | — | 3.55x | — |
Highest recall each engine actually reached: Rostam 0.9978 @ 714 QPS; Qdrant 0.9968 @ 277; Milvus 0.9906 @ 805; pgvector 0.9897 @ 603; Weaviate 0.9829 @ 757; Redis 0.9828 @ 240.
The flip side, and it matters: at matched ef, Rostam's recall is lower than Milvus's, pgvector's and Qdrant's. Its ef is simply cheaper per unit — Rostam at ef=600 beats Milvus at ef=300 on both recall and throughput — which is exactly why matched-ef comparisons mislead in either direction.
Load
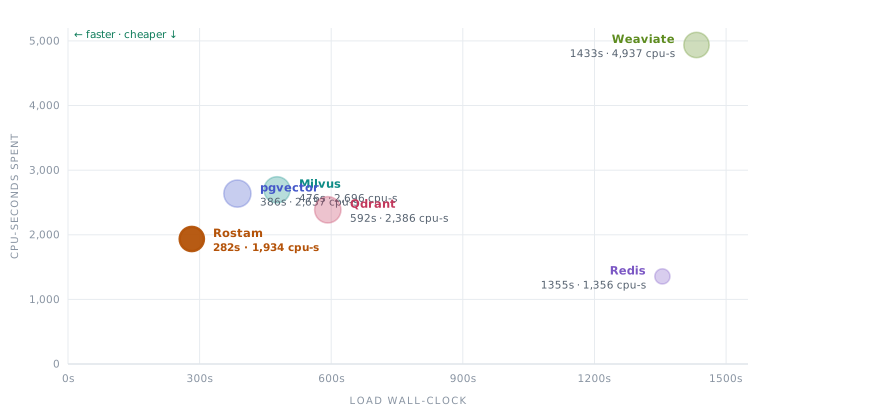
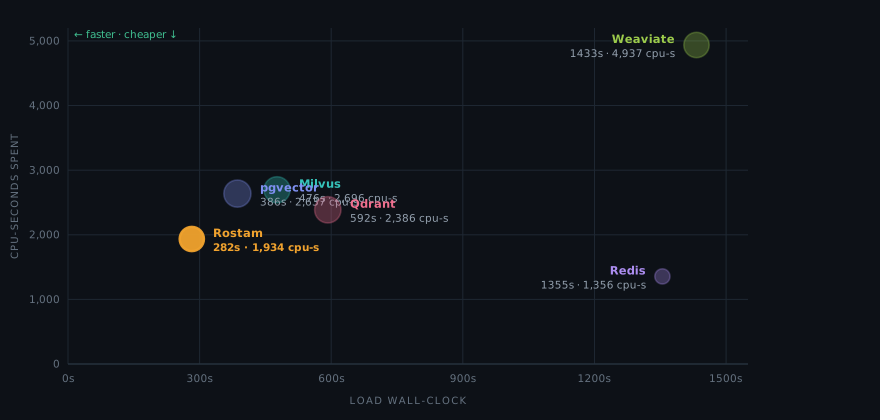
Ingesting and indexing the same 1M vectors (ef=300 row), wall-clock and engine-only CPU-seconds:
| Engine | Wall-clock | CPU-seconds |
|---|---|---|
| Rostam | 282.2 s | 1,934 |
| pgvector | 386.1 s | 2,637 |
| Milvus | 476.3 s | 2,696 |
| Qdrant | 592.2 s | 2,386 |
| Redis | 1,354.9 s | 1,356 |
| Weaviate | 1,432.7 s | 4,937 |
The query wire
Rostam takes a query vector either as JSON text or as raw f32 over a binary
framing. The comparison above was swept over JSON, which is the slower of
the two, so it measures the engine through its least efficient transport.
Isolating the wire at one point on that curve — ef_search=300, which lands
at recall ≈0.969, so effectively the 0.97 row — on the same box and corpus.
Three same-session pairs, each loading once and then running both arms against
that single index:
| Pair | Corpus loaded by | JSON | Binary | Ratio |
|---|---|---|---|---|
| 1 | JSON | 2,718.3 QPS | 3,163.2 QPS | 1.164x |
| 2 | binary | 2,738.9 QPS | 3,177.8 QPS | 1.160x |
| 3 | JSON | 2,776.8 QPS | 3,276.6 QPS | 1.180x |
+16.8% throughput, and −19% on single-client p99 — 7.8–7.9 ms over JSON against 6.2–6.5 ms over the binary wire. (Throughput comes from the concurrent stage and the latency from the serial one, as VectorDBBench measures them.)
Pair 2 reverses which arm loads the corpus and which inherits the warm index; the advantage does not move, which is what separates a transport effect from a page-cache one. Recall is identical within every pair to four decimals, so this buys throughput without changing which points come back.
Do not spread that percentage across the sweep. What the wire removes is a
roughly fixed cost per query — the client's encode and the server's decode of
the same vector — so it is a larger fraction of a cheap low-ef search and a
smaller one at high recall, where the search itself dominates. Only the
ef_search=300 point was measured both ways; the rest of the curve is unknown.
As a cross-check on where this sits, the JSON arm here ran 2,718–2,777 QPS at recall 0.9692–0.9695, against the 2,642 QPS the table records at recall 0.97 — about 4% apart, in different sessions on a box documented to drift far more than that.
Sweeping the comparison over the binary wire would not be a thumb on the scale: VectorDBBench drives Milvus over gRPC and every other engine through its own native SDK, so Rostam was the only one measured through a text protocol. The table is nevertheless left exactly as measured — see the caveats below for why re-running one arm of it would cost more than it bought.
Read the caveats with the numbers
They are what make the numbers honest:
- Every figure is same-session. With engine code unchanged, Milvus's own max QPS has drifted 42% between sessions on that box. Cross-session comparison is unsupported.
- The QPS figures are floors, not ceilings. The benchmark client shares the same 12 cores with the engine, and the system runs oversubscribed at high concurrency — which penalises the fastest engine hardest.
- The comparison ran over Rostam's JSON wire. The binary framing measures
+16.8% at
ef_search=300(above) — one point on this curve, near the 0.97 row — and that percentage is not transferable to the other rows: the wire saves a roughly fixed amount of encode and decode per query, so it is a larger share of a cheap low-efsearch and a smaller one at high recall, where the search itself dominates. The table is therefore conservative by an unmeasured amount rather than by 16.8%. It stays as measured: the competitor arms were not re-run, and splicing a re-measured Rostam arm into same-session competitor numbers would destroy the one property that makes a ratio mean anything. - Comparators were tuned up, not down. pgvector was given
maintenance_work_mem=6GB, 11 parallel maintenance workers and a raised/dev/shm(its defaults build HNSW single-threaded in a 64MB buffer, and Docker's default/dev/shmmakes a parallel build fail outright). The stock Weaviate VDBBench adapter was patched because it tears down aBatchExecutorshared across concurrent insert workers.
Full per-case results, configs, and methodology:
rostam-bench/vectordbbench.
Comparisons (in rostam-bench)
| Suite | Compares Rostam against | Harness |
|---|---|---|
| Vector | Qdrant, Milvus, pgvector, Weaviate, Redis | VectorDBBench plugin + Cohere-1M (summarised above) |
| Networked KV | Redis, Aerospike (throughput + latency over the wire) | custom Go load-gen |
| In-memory cache | freecache, Ristretto, BigCache, fastcache, Otter | identical-workload Go benchmark |
All comparison code, configs, and methodology notes are in
rostam-bench.